SEOSEO Optimization
Website performance is defined as the speed, stability, and responsiveness of a website as experienced by real visitors. It directly determines whether those visitors convert, return, or leave. Every 1-second delay in page load time reduces conversion rates by approximately 7%, and 53% of mobile visitors abandon a site that takes longer than 3 seconds to load. Google’s Core Web Vitals, which measure Largest Contentful Paint (LCP), Interaction to Next Paint (INP), and Cumulative Layout Shift (CLS), are now official ranking signals. For business owners and digital marketers, understanding why website performance matters is not a technical exercise. It is a revenue decision.
Why website performance matters for conversions and user experience
Site speed shapes a visitor’s first impression before they read a single word of your content. Speed impressions form before users engage with any content, acting as a direct proxy for brand trust and competence. A slow site signals unreliability, and that signal costs you leads.
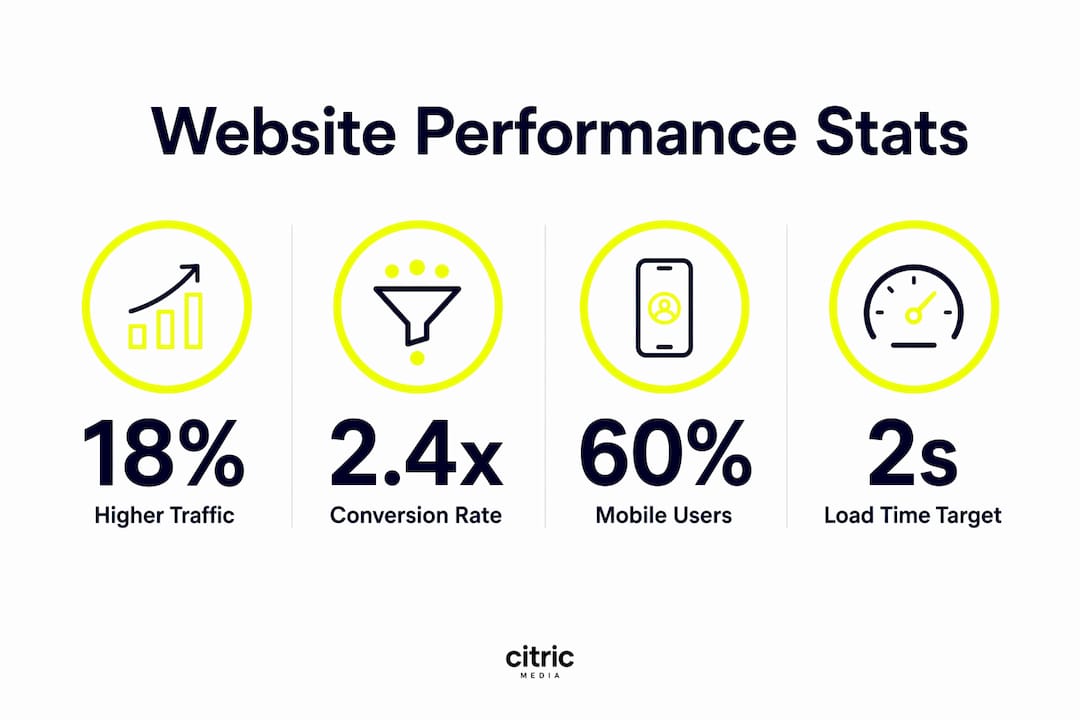
The conversion data is unambiguous. Sites loading under 2 seconds achieve up to 2.4 times higher conversion rates compared with sites taking 5 or more seconds. That gap compounds across every paid campaign, every organic visit, and every returning customer. If you are spending money on Google Ads or paid social, a slow landing page is quietly eroding your return on every pound spent.

Mobile performance carries particular weight. Mobile users generate over 60% of web traffic, yet mobile pages load on average 1.7 times slower than desktop. That mismatch between traffic volume and load speed is where most businesses silently haemorrhage conversions.
The key UX metrics that marketers must monitor include:
- Load time: How long the page takes to display meaningful content (target under 2 seconds)
- Interactivity: How quickly the page responds to clicks and taps (measured by INP)
- Visual stability: Whether elements shift unexpectedly as the page loads (measured by CLS)
- Time to First Byte (TTFB): How fast the server begins responding (target under 500ms)
- Bounce rate: The percentage of visitors who leave without interacting
Pro Tip: Test your site on a mid-range Android device using a 4G connection, not a high-end laptop on fibre. That test reflects the real conditions most of your mobile visitors face.
How does site speed affect SEO and AI search rankings?
Google’s march 2026 core update increased the ranking weight of Core Web Vitals, making passing all three metrics essential for competitive organic positions. The impact is largest on mobile results, where performance gaps between sites are most pronounced.
The organic traffic benefit of meeting these standards is measurable. Sites passing all Core Web Vitals gain 18% higher organic traffic on average. Yet only 42% of mobile sites currently meet these standards as of Q2 2026. That means the majority of your competitors are leaving organic traffic on the table, and a well-optimised site has a clear structural advantage.
AI-powered search engines add a further layer of urgency. AI search engines deprioritise websites with high TTFB and frequent errors, reducing their citation and mention rates in AI-generated answers. Faster server response, specifically under 500ms TTFB, correlates with higher visibility in AI search results. As tools like Perplexity and AI Overviews in Google become primary discovery channels, slow sites face a compounding disadvantage.
Speed also affects crawl efficiency. Search engine bots allocate a crawl budget to each site. Slow pages consume that budget faster, meaning fewer pages get indexed per crawl cycle. For sites with large product catalogues or frequent content updates, this has a direct impact on how quickly new pages appear in search results.
The table below shows the Core Web Vitals thresholds and their ranking implications:
| Metric | Good | Needs improvement | Poor | Ranking impact |
|---|---|---|---|---|
| LCP (load) | Under 2.5s | 2.5s–4s | Over 4s | High |
| INP (interactivity) | Under 200ms | 200ms–500ms | Over 500ms | High |
| CLS (stability) | Under 0.1 | 0.1–0.25 | Over 0.25 | Medium |
| TTFB (server) | Under 500ms | 500ms–1,800ms | Over 1,800ms | Medium |
Pro Tip: Use Google Search Console’s Core Web Vitals report alongside field data from Chrome User Experience Report (CrUX). Lab scores from tools like PageSpeed Insights can look healthy while real users still experience slow pages.
What causes poor website performance?
Unoptimised images are the single most common cause of slow load times. A homepage with several large, uncompressed JPEG files can add 3–5 seconds to load time on mobile. Converting images to WebP or AVIF format and applying lazy loading resolves this without any change to visual quality.
Heavy JavaScript is the second major culprit. Excessive third-party scripts, including chat widgets, analytics tags, and advertising pixels, block the main thread and delay interactivity. Each script added to a page without performance review is a potential INP failure waiting to happen.
Infrastructure choices have an outsized effect that many business owners underestimate. Weak shared hosting leads to slow server response during traffic spikes, damaging both reliability and user experience. Upgrading to SSD or NVMe storage with server-side caching directly improves TTFB and revenue outcomes. Hosting is not an IT cost. It is a business-critical infrastructure decision.
One measurement pitfall deserves specific attention. Aggregate site speed averages can mask significant slow experiences for real users. A histogram of page load distribution reveals how frequently visitors encounter slow pages, which an average score hides entirely. A site with a median load time of 2.1 seconds might still be delivering 5-second loads to 20% of its visitors. Those visitors represent a conversion-killing segment that average reporting never surfaces.
The most common infrastructure and optimisation areas to address are:
- Hosting quality: Move from shared hosting to managed cloud or VPS with NVMe storage
- Content Delivery Network (CDN): Serve static assets from servers geographically close to your visitors
- Browser caching: Set appropriate cache headers so returning visitors load pages faster
- Image compression: Use WebP or AVIF formats with responsive sizing
- JavaScript auditing: Remove or defer non-critical third-party scripts
- Server-side caching: Use tools like Redis or Varnish to reduce database load
Practical steps to improve and sustain website performance
One-time audits do not sustain performance. Every deployment, content update, or new plugin can introduce a regression. Successful teams treat Core Web Vitals as production-grade Service Level Indicators, monitoring them continuously in the same way they track uptime or error rates. This shift in mindset, from periodic audit to live metric, is what separates teams that maintain performance from those that repeatedly fix the same problems.
Real-user monitoring (RUM) tools capture field data from actual visitors rather than synthetic lab tests. RUM data reflects the full range of devices, connections, and geographies your visitors use. It is the only reliable way to know whether your performance investments are working for your actual audience.
The following numbered steps give business owners and marketers a practical framework for sustained improvement:
- Establish a baseline. Run a Core Web Vitals audit using Google Search Console and PageSpeed Insights. Record current LCP, INP, CLS, and TTFB scores.
- Prioritise by traffic impact. Fix performance issues on your highest-traffic pages first. A 10% improvement on your homepage delivers more revenue than a 50% improvement on a rarely visited page.
- Implement real-user monitoring. Deploy a RUM solution to capture field data continuously. Review it weekly, not monthly.
- Integrate performance into your deployment workflow. Add automated performance checks to your staging environment so regressions are caught before they reach live visitors.
- Review third-party scripts quarterly. Audit every tag, pixel, and widget. Remove anything that does not have a clear, measurable business purpose.
- Align marketing and development teams. Performance targets should appear in campaign briefs, not just technical specifications. Marketers who understand campaign optimisation and site speed together make better decisions about landing page design and ad spend.
The table below summarises key optimisation tactics and their expected benefits:
| Tactic | Expected benefit |
|---|---|
| Image compression to WebP/AVIF | Reduces page weight by 25–50%, improves LCP |
| CDN implementation | Lowers TTFB for geographically distributed visitors |
| JavaScript deferral | Improves INP and interactivity scores |
| Server-side caching | Reduces TTFB during traffic spikes |
| Managed hosting upgrade | Improves baseline TTFB and uptime reliability |
| Real-user monitoring | Surfaces hidden slow segments missed by averages |
Key takeaways
Website performance is a direct revenue driver: slow sites lose conversions, organic rankings, and AI search visibility simultaneously.
| Point | Details |
|---|---|
| Speed drives conversions | A 1-second delay reduces conversion rates by 7%; sites under 2 seconds convert up to 2.4x better. |
| Core Web Vitals are ranking signals | Passing LCP, INP, and CLS gives sites 18% more organic traffic on average. |
| AI search rewards fast sites | TTFB under 500ms correlates with higher citation rates in AI-generated search results. |
| Infrastructure is a revenue decision | Weak hosting and poor caching cause TTFB failures that cost leads during traffic spikes. |
| Continuous monitoring is non-negotiable | One-time audits miss regressions; treat Core Web Vitals as live production metrics. |
My blunt view on where most businesses get this wrong
The most persistent mistake I see is treating website performance as something the development team owns. Marketing teams plan campaigns, set budgets, and write briefs, then hand a slow landing page to paid traffic and wonder why their cost per lead is climbing. The two are inseparable.
Website performance improves paid media efficiency by lowering cost per click and increasing ad quality scores. Google’s Ad Rank formula rewards landing page experience directly. A faster page earns a better Quality Score, which reduces what you pay per click. That means performance investment pays back through your ad budget, not just your organic rankings.
The AI search dimension changes the stakes further. As AI Overviews and tools like Perplexity become primary discovery channels for business buyers, the sites that get cited are the ones that load fast, respond reliably, and present structured, trustworthy content. A slow site is not just losing Google rankings. It is being excluded from the answers AI gives to your potential customers.
My practical advice is to monitor your digital campaigns and your Core Web Vitals in the same dashboard. When your cost per lead rises, check your performance metrics before you adjust your bids. The problem is often on the page, not in the auction.
— Martin
How Citricmedia can help you perform better online
Citricmedia has spent over 27 years helping UK businesses generate more leads and sales through performance-driven digital marketing. Website speed and technical health sit at the centre of that work, because no campaign delivers its full return when the landing page is slow or unreliable.

Whether you need a full technical audit, managed hosting that holds up under traffic spikes, or an SEO strategy built around Core Web Vitals, Citricmedia brings the expertise to make it count. Our approach connects SEO and site performance directly to your revenue targets, not just your rankings report. If your site is losing leads to slow load times, the fix is closer than you think.
FAQ
What is a good page load time for a business website?
A load time under 2 seconds is the target for strong conversion performance. Sites loading under 2 seconds achieve up to 2.4 times higher conversion rates than those taking 5 or more seconds.
How do Core Web Vitals affect my Google rankings?
Core Web Vitals are official Google ranking signals. Sites passing all three metrics (LCP, INP, and CLS) gain 18% more organic traffic on average, with the largest impact on mobile search results.
Why is mobile performance more important than desktop?
Mobile users account for over 60% of web traffic, yet mobile pages load 1.7 times slower than desktop on average. Slow mobile load times directly increase bounce rates and reduce conversions from your largest traffic source.
Does website speed affect paid advertising results?
Yes. Google’s Ad Rank formula includes landing page experience as a factor. A faster page earns a higher Quality Score, which reduces your cost per click and improves ad placement without increasing your budget.
How often should I check my website performance?
Performance should be monitored continuously, not just during audits. Every deployment or content update can introduce a regression, so treating Core Web Vitals as live production metrics rather than periodic checks is the standard approach for teams serious about growth.